How TransMonis contributing to resolve CX challenges in Ed-tech industry

Indian Ed-tech industry is pegged at 30 Billion USD over the next decade. TransMon is trusted by the biggest Ed-tech giants in India for CX touchpoint monitoring / Quality Monitoring.

- Offline Payment Reconciliation resulting in delay in product delivery.
- Mis-handling of Hassle free money back Guarantee / Refund related transactions.
- The rise in adoption has resulted in demand-supply gap for good Educators. Internal recruitment process requires Quality Audits to ensure the on-boarding of capable educators.
- Internal Sales / CS monitoring process not aligned with end customer expectation.

- Automated and Digitized the auditing process with TransMon to replace Legacy/excel based system through complete overhaul of the process.
- Institutionalize single window system to cover Sales / Educator Support / Student Support & Business Critical Audits.
- Data driven Sampling plans to ensure representative results through Artificial Intelligence and through native integration with existing technology stacks (ACD/CRMs).
- BI Platform – OpsGuru culled out actionable inputs from population data. Using this information Sampling plan basis top call drivers, risks & fraud reasons done. Also facilitated much better control and visibility to the management through an array of reports and dashboarding options.

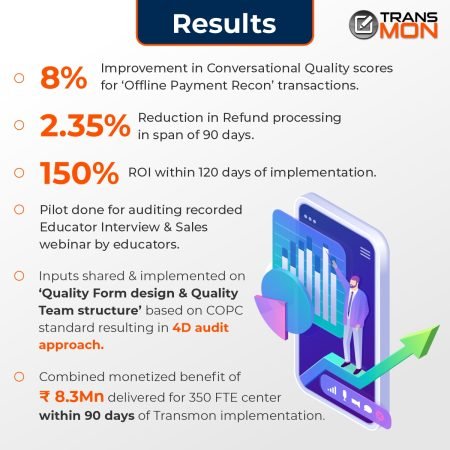
- 8% Improvement in Conversational Quality scores O for ‘Offline Payment Recon’ transactions.
- 2.35% Reduction in Refund processing in the span of 90 days.
- Pilot done for auditing recorded Educator Interview & Sales webinar by educators.
- Inputs shared & implemented on ‘Quality Form design & Quality Team structure’ based on COPC standard resulting in 4D audit approach.
- Combined monetized benefit of ₹ 8.3M n delivered for 350 FTE centers within 90 days of Transmon implementation.
Special project – Identifying Unnecessary Response & improvement in Resolution time
Wasteful usage of 14% FTE in Student support group identified on account of unnecessary responses sent in email queue.
Note: FTE numbers are changed for confidentiality reasons. Similar work was done for chat / Social media & special desk queues.
| S. No | Header | Details | Comments |
|---|---|---|---|
| 1 | Unique Tickets | 130 | Special project study |
| 2 | Tickets with unnecessary response | 14 | |
| 3 | %age tickets with unnecessary response | 10.77% | |
| 4 | Average time taken to respond to 1 ticket (in minutes) | 10% | Assumption |
| 5 | Average time taken to respond to 1 ticket (sec) | 600 | |
| 6 | Total time available for agent in a day (in sec) | 28800 | |
| 7 | Average count of tickets per day / agent | 48 | |
| 8 | Error prone ticket / day | 5 | |
| 9 | Average salary of agent / day | ₹ 1,458 | Assumption 35K monthly CTC with load |
| 10 | Cost per ticket reply | ₹ 30.38 | |
| 11 | Leakage /agent / day | ₹ 157.05 | |
| 12 | Total agent in queue | 1000 | (only for Illus. Not actual queue size) |
| 13 | Leakage / day for Queue | ₹ 1,57,050 | |
| 14 | Leakage / month for queue | ₹ 47,11,500 | |
| 15 | Leakage – FTE | 14% | |
| 16 | Annualized leakage | ₹ 5,65,38,000 |
Ed-Tech Client


