


A word that has the power to amplify anything and everything. Every product, service, process, task, action, or decision in an organization can be judged in terms of its quality – how good is it, is it good enough, and how can we make it better? This is where Quality Monitoring comes into the picture.
To survive and thrive, you need to constantly pursue excellence; need to manage Quality, and improve quality. But do you know how to manage it or what is Quality Monitoring /Management?
Quality monitoring is the act of overseeing all activities and tasks that must be accomplished to maintain a desired level of excellence. This includes the determination of a quality policy, creating and implementing quality planning and improvement, quality control, and quality assurance.

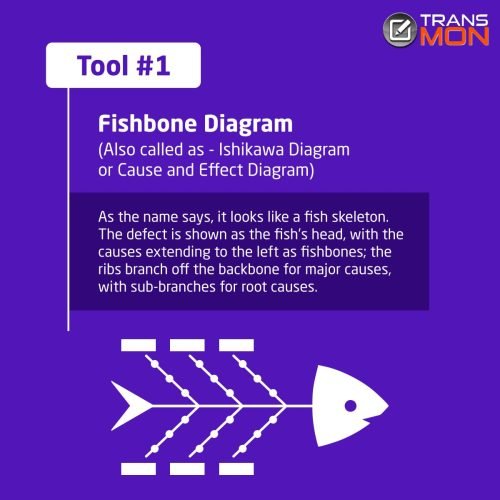
Are you thinking there will be some tools for managing all these activities? Of course, there are specific tools, So we will study about 7 QC tools (The basic tool or the first invented Quality tools) used for bits of help in taking a systematic approach to identify and understand the risk, assess the risk, control fluctuation of product quality, improve customer experience and accordingly provide solutions to avoid future defects. The 7 Quality Tools are widely applied by many industries for product and process improvements, and to solve critical quality problems. Out of these 7 QC tools, today let’s study– the “Fishbone Diagram”, also called as “Ishikawa Diagram” and “Cause and Effect Diagram”.
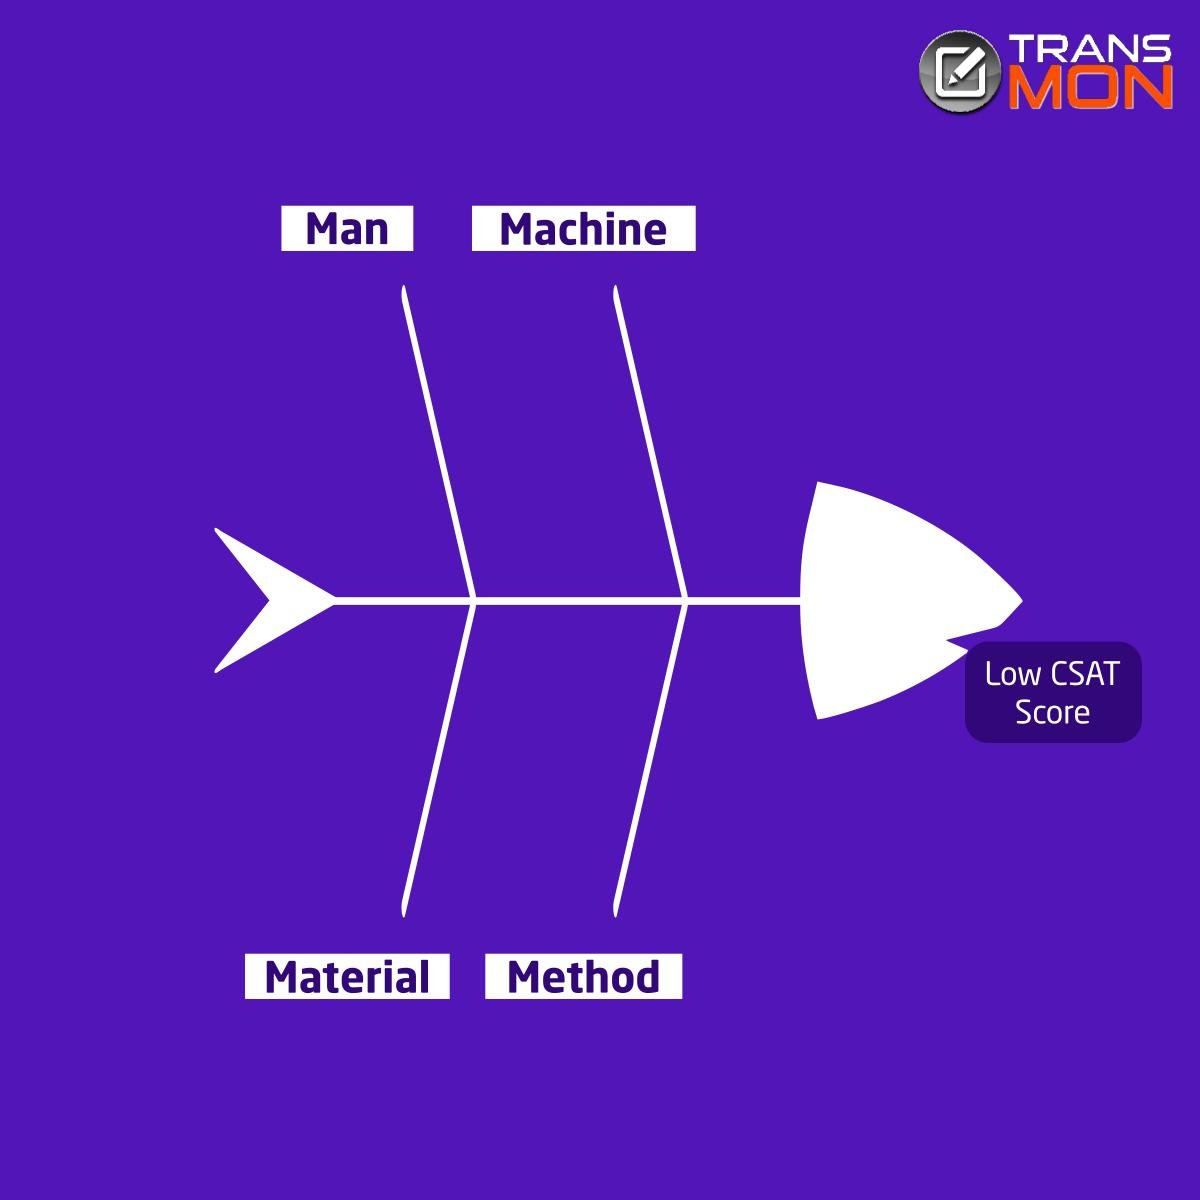
As the name says, it looks like a fish skeleton.The defect is shown as the fish’s head, facing to the right, with the causes extending to the left as fishbones; the ribs branch off the backbone for major causes, with sub-branches for root causes.Developed by Kaoru Ishikawa of Japan, in the 1960s. The technique was then published in his 1990 book, “Introduction to Quality Control“; this brainstorming technique is
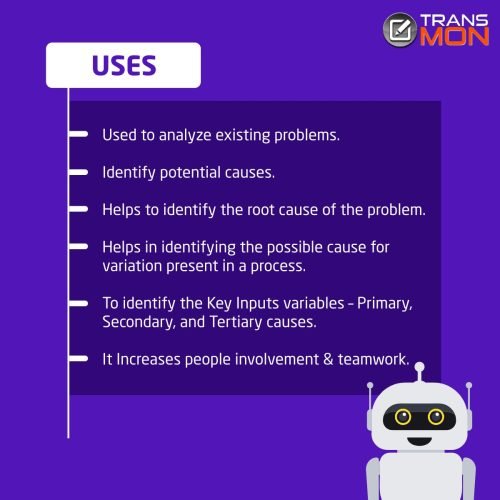
- Used to analyze existing problems
- Identify potential causes.
- Helps to identify the root cause of the problem.
- Helps in identifying the possible cause for variation present in a process.
- To identify the Key Inputs variables – Primary, Secondary, and Tertiary causes.
- It Increases people involvement & teamwork. Understanding the contributing factors or causes of a system failure can help develop actions that sustain the correction
How to Use the Tool
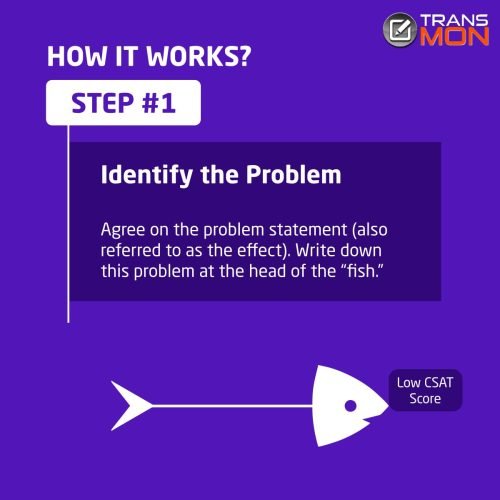
Step 1: Identify the Problem
Agree on the problem statement (also referred to as the effect). Write down this problem at the head of the “fish.”
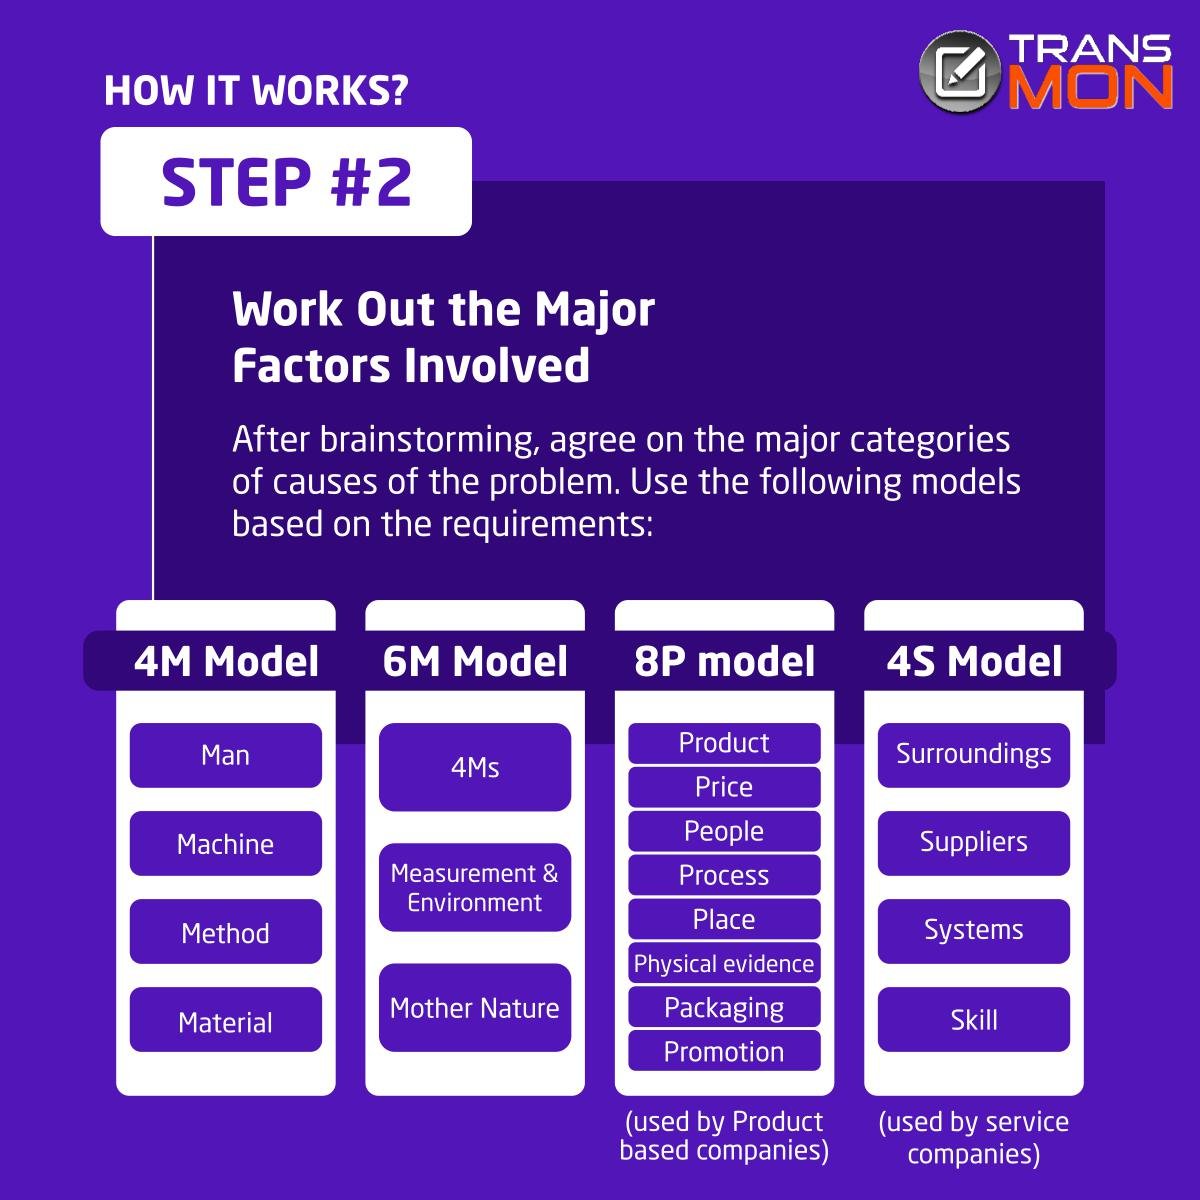
Step 2: Work Out the Major Factors Involved
After brainstorming, agree on the major categories of causes of the problem (written as branches from the main arrow). Just knowing what problem arose or may arise is not enough. You need reasons, but one reason may not be enough. The 5 Whys technique can help you to dig below the surface. These may be systems, equipment, materials, external forces, people involved with the problem, and so on.
Major categories often include 4M (Man, Machine, Method & Material) or 6M (along with 4Ms Measurement & Environment – Mother Nature).
Product marketing industries use the 8P model – Product, Price, People, Process, Place, Physical evidence, Packaging & Promotion. 4S (Surroundings, Suppliers, Systems, and Skill) used by service industries. Define possible causes categories as per the Problem and the industry dependence.
Step 3: Identify Possible Causes
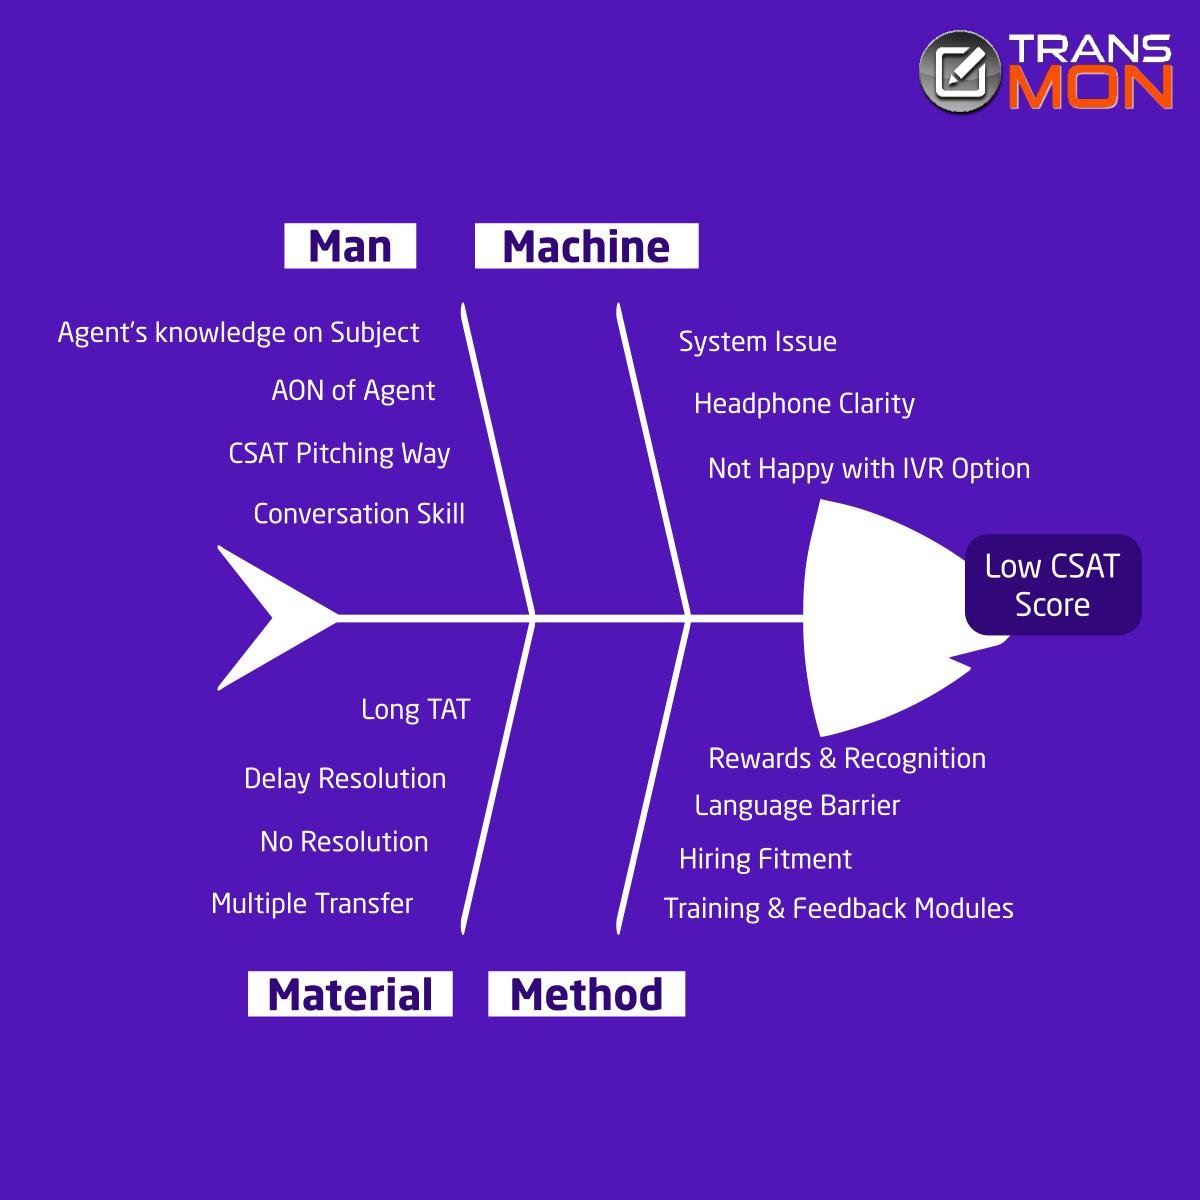
Now, for each of the factors you considered in step 2, brainstorm possible causes of the problem that may be related to the factor. The cause is large or complex, then it may be best to break it down into sub-causes. Show these as lines coming off each cause line.
EVENTUAL OUTCOME
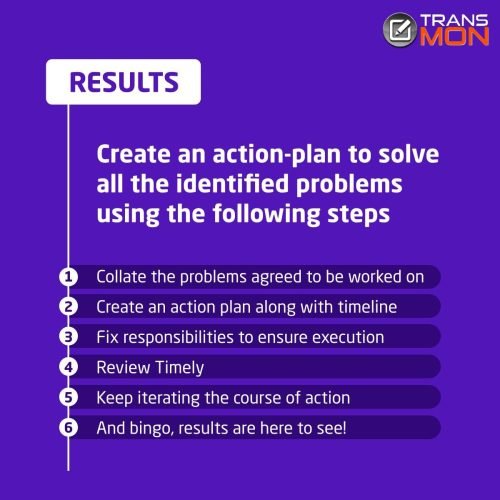
Once we are done with the identification of possible problems, we move to create an action plan around the following below step-
- Collate the problems agreed to be worked on. Create an action plan along with timelines and prefixed responsibilities to ensure execution.
- Timely review for the plan charter created to track efficacy on the problem efficacy.
- In case proposed solutions are not giving results during the review of track change the course.
- The eventual outcome is to get the tractions as per the planning done and the problems identified in the head of the diagram.
For example- In the case of CSAT dissection, we will have traction in CSAT numbers and will have a marginal reduction in DSAT counts.