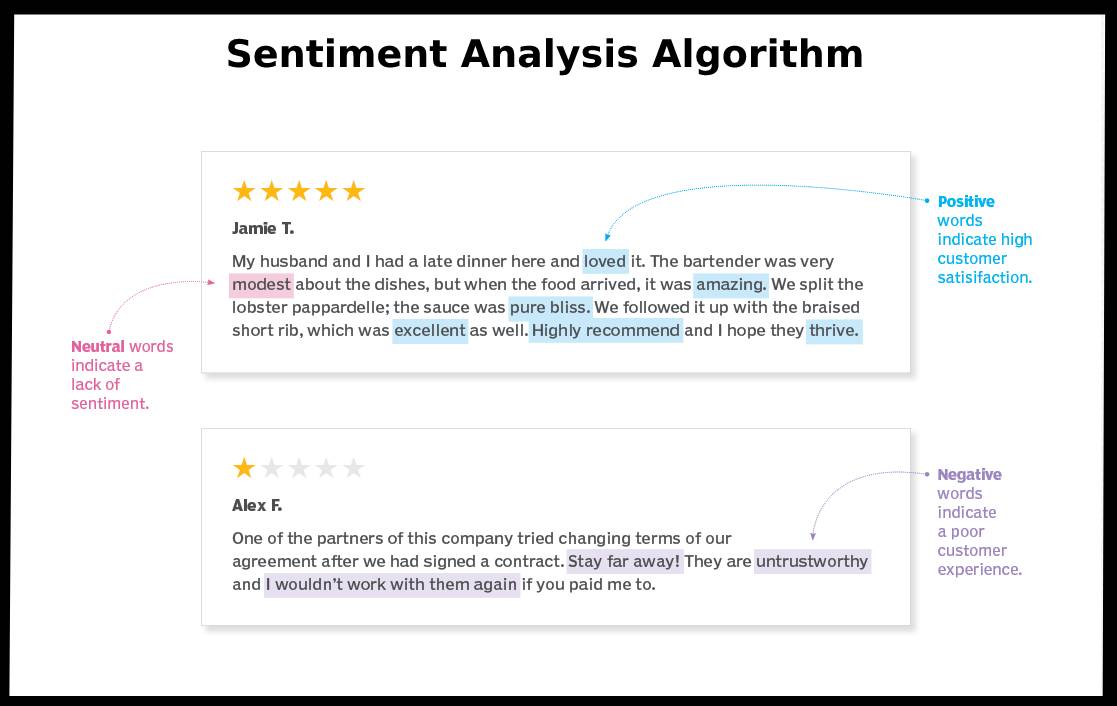
Sentiment analysis is a text analytics technique that involves identifying and extracting subjective information from text data, such as opinions, attitudes, and emotions. By using sentiment analysis on customer interactions, contact centers can gain valuable insights into customer sentiment and satisfaction levels.

Let me try an explain you with an example-
Sentiment Analysis for an eCommerce Company
Background: Imagine an eCommerce company, it collects feedback from customers who have made purchases on their online store. The feedback includes written reviews and ratings (e.g., 1 to 5 stars) provided by customers. Classfiers: price, delivery, courtesy, and policy
Objective -The company wants to understand customer sentiments to identify areas of improvement and enhance overall customer satisfaction.
1. Data Collection
The company has collected data from 1000 customer reviews, including the written feedback and corresponding ratings provided by customers.


2. Data Pre-processing
The collected data is processed to remove irrelevant information, such as usernames or URLs. Text normalization techniques, such as converting all text to lowercase, removing punctuation, and breaking text into words or phrases (tokenization), are applied.

3. Feature Extraction:
The processed text is converted into numerical features using the bag-of-words (BoW) technique . This technique represents each review as a vector of word frequencies.


4. Sentiment Analysis Algorithm:
Logistic Regression is a commonly used algorithm for sentiment analysis as it can classify data into discrete categories, such as positive, negative, or neutral sentiment. The trained model uses the numerical features (BoW representation and ratings) to predict the sentiment label (positive, negative, or neutral) for each customer review.
5. Statistical Analysis
Once the sentiment labels are predicted for all customer reviews, the sentiment distribution and association with auto classifiers (price, delivery, courtesy, and policy) are analyzed using descriptive statistics and cross-tabulations.
Descriptive statistics, such as frequencies and percentages, are used to summarize the sentiment distribution.
Cross-tabulations are used to examine the association between sentiment and auto classifiers.
Example: A cross-tabulation between sentiment and price could look like:
| Features |
High Price (%) |
Moderate Price (%) |
Low Price (%) |
| Positive | 20 | 60 | 80 |
| Negative | 80 | 40 | 20 |
| Neutral | 0 | 0 | 0 |
What do we understand from the above cross-tabulation data?
It can be observed that 80% of negative sentiments are associated with high prices, while only 20% of negative sentiments are associated with low prices.
Based on the statistical analysis, the following conclusions can be drawn:
Negative sentiment

The primary reason for negative sentiment among customers is associated with high prices, as 80% of negative sentiments are correlated with high prices. This suggests that pricing strategies should be revisited to address customer concerns and potentially lower prices to improve overall customer satisfaction.
Delivery and courtesy

The sentiment analysis does not show a strong association between negative sentiment and delivery or courtesy. This implies that the company’s delivery and customer service may not be significant factors contributing to negative customer sentiment.
Policy

The sentiment analysis does not reveal a clear correlation between negative sentiment and policy. However, further investigation may be needed to identify specific policy-related issues that could potentially impact customer sentiment.
In conclusion
The statistical analysis of customer sentiment for the E commerce company indicates that high prices are the primary driver of negative sentiment among customers.
By addressing pricing concerns and continuously improving delivery, customer service, and policies, the company can enhance overall customer satisfaction and drive positive sentiment.
Optimize Customer & Agent Experience through TransMon AI.
Speech & Text Analytics for customer retention and higher profits
Book a slot with TransMon Expert


